Stratification and Dataset Splitting
WSI.stratification module
About this module
This module provides the stratification class for splitting image datasets into training, validation, and testing subsets, with support for both random and stratified approaches.
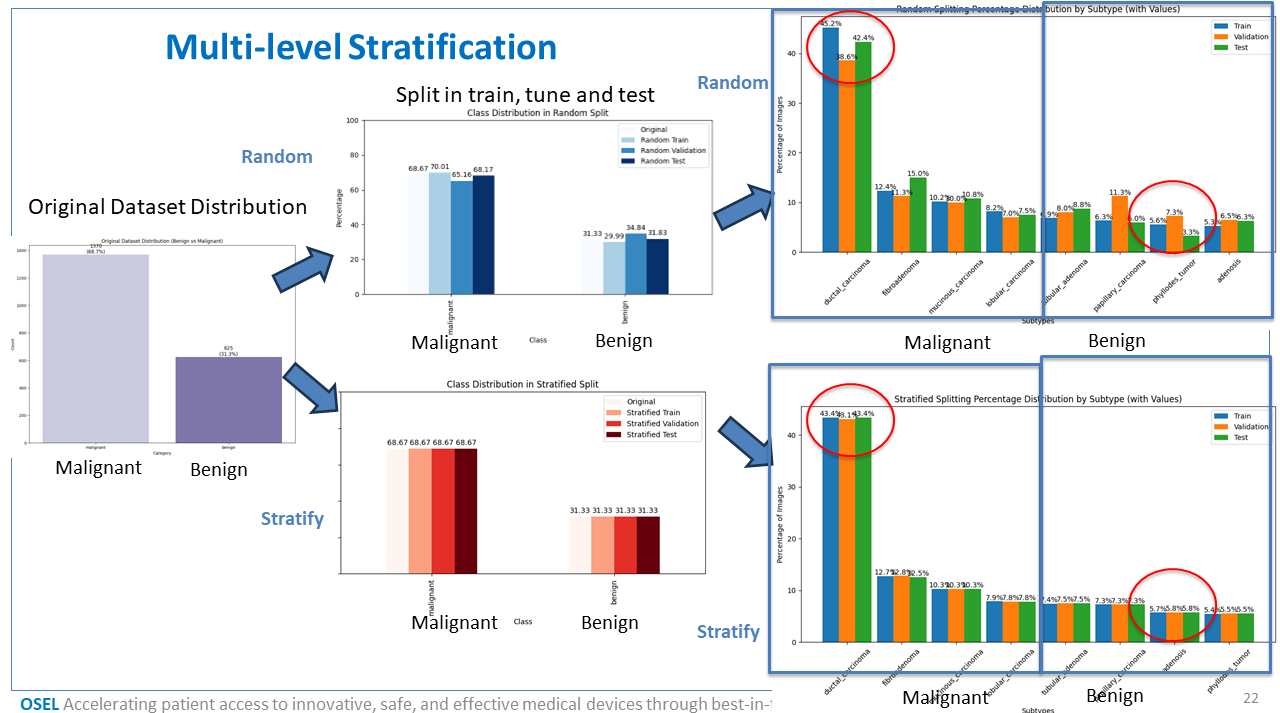
Stratification can be performed at two levels: - By category (e.g., Tumor vs. Normal) - By subtype (e.g., Tumor subtypes like Adeno, Squamous, etc.)
The module also offers visualization tools to help assess class distribution across different dataset splits — which is especially important in medical imaging and machine learning applications to avoid data imbalance and biased model training.
Loading Required Packages
To use the stratification module, import the main class:
from WSI.stratification import stratification
Dependencies (install if not already available):
pip install pandas seaborn matplotlib scikit-learn
Dataset Organization
The input dataset should be structured into categories and subcategories (subtypes). The module expects this directory layout:
dataset_root/
    Category1/
        SubtypeA/
            image1.jpg
            image2.jpg
        SubtypeB/
    Category2/
        SubtypeC/
To define this in code, use a dictionary like:
categories = {
    "Category1": {
        "path": "dataset_root/Category1",
        "subcategories": ["SubtypeA", "SubtypeB"]
    },
    "Category2": {
        "path": "dataset_root/Category2",
        "subcategories": ["SubtypeC"]
    }
}
Create the Stratification Object
Once the dataset structure is defined, initialize the stratification handler:
stratifier = stratification(root_dir="dataset_root", categories=categories)
This will parse the directory structure and internally store metadata in a Pandas DataFrame.
Perform Dataset Splits
The following split options are available:
Random Split by Subtype (unbalanced but fast):
X_train, X_val, X_test = stratifier.split_random()
Stratified Split by Subtype (preserves subtype distribution):
X_train, X_val, X_test = stratifier.split_stratified()
Random Split by Category:
X_train, X_val, X_test = stratifier.split_random_by_category()
Stratified Split by Category:
X_train, X_val, X_test = stratifier.split_stratified_by_category()
Visualize Class Distribution
Plot full dataset distribution by category:
stratifier.plot_category_distribution(stratifier.df)
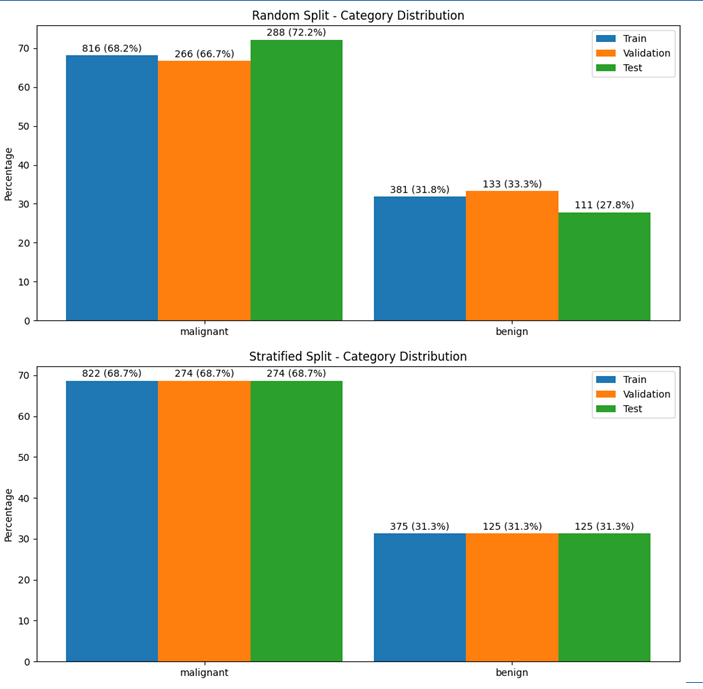
Compare splits across sets (Train/Val/Test) for categories:
split_dict = {
    "Train": X_train["category"].value_counts().to_dict(),
    "Validation": X_val["category"].value_counts().to_dict(),
    "Test": X_test["category"].value_counts().to_dict()
}
stratifier.plot_category_split_distribution(split_dict)
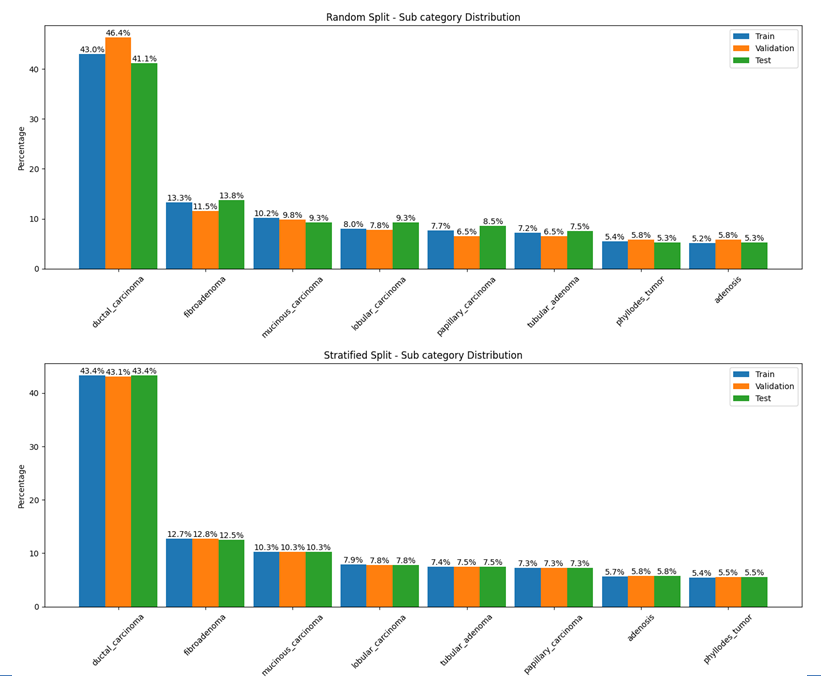
Compare splits across sets for subtypes:
subtype_dict = {
    "Train": X_train["subtype"].value_counts().to_dict(),
    "Validation": X_val["subtype"].value_counts().to_dict(),
    "Test": X_test["subtype"].value_counts().to_dict()
}
stratifier.plot_subtype_distribution(subtype_dict)
Saving and Reusing Splits (Optional)
You can save the splits as CSV files for reproducibility:
X_train.to_csv("splits/train.csv", index=False)
X_val.to_csv("splits/val.csv", index=False)
X_test.to_csv("splits/test.csv", index=False)
Later, you can reload them as DataFrames for model training:
import pandas as pd
train_df = pd.read_csv("splits/train.csv")