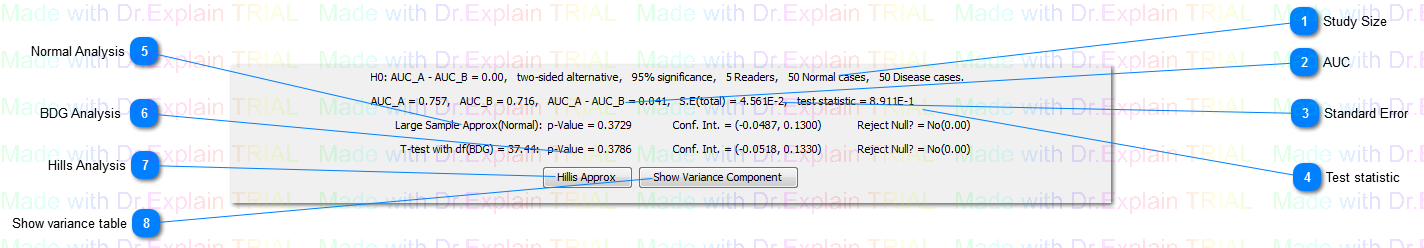
This method assumes test statistic comes from a normal distration (z-test ). Results include P-Value, Confidence Interval, and Hypothesis test result (Yes = 1, No = 0).
This method assumes test statistic comes from a t-distribution with BDG degree of freedom (t-test ). Results include P-Value, Confidence Interval, and Hypothesis test result (Yes = 1, No = 0).
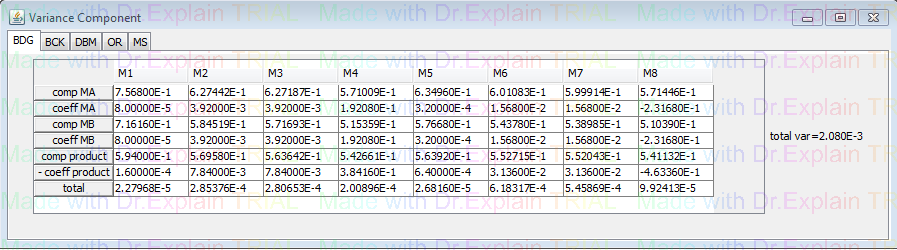
The botton open Variance Component window. It shows the components of variance, which can be given in five different representations. For the BDG and BCK representation we have 7 total rows. The “comp MA” and “comp MB” rows show the components for each modality, and the “coeff MA, MB” rows give the corresponding coefficients/weights for each component of variance. The “comp product” shows the covariance components for both modalities, and the “- coeff product” gives its coefficient/weight. The “total” row displays the contribution towards the total variance by each component. The contributions are summed to produce the total variance, and the square root of that is the standard error, which is displayed to the right of the table. The DBM, OR, and MS tabs are only available for fully crossed analysis data. They are similar as the frist 2 tabs, but only contain 3 rows, showing the components, coefficients, and total without separating by modality.
If any of the resulting components are negative, the user will be asked if they would like to use MLE estimates instead of the usual u-statistics estimates. The MLE estimates of the components are never negative, and this can help with calculating the variance/error sometimes. If MLE estimates are being used, a double asterisk (**) will appear next to the decomposition names in the table.