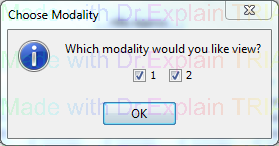
The Show ROC Curve button can display readers individual and average ROC curves for multiple modalities, and then displays the ROC curves for the given modality. At first, user should select a modality to view (multiple choices is available) .
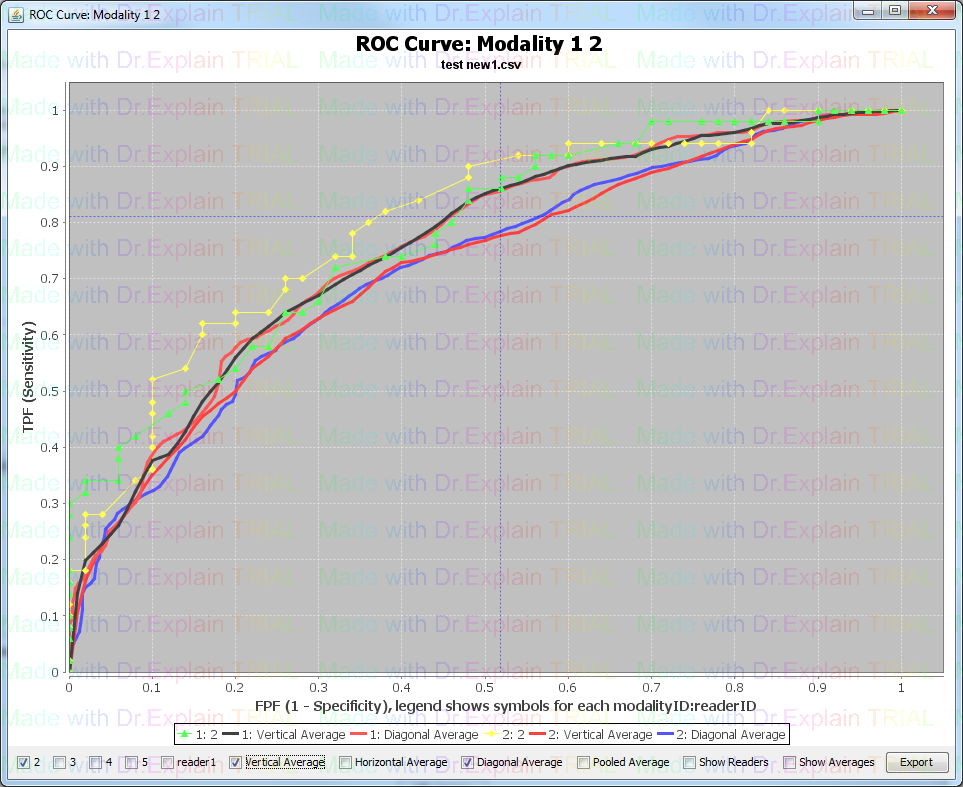
Selecting the various checkboxes on the bottom border of the chart window enables/disables ROC curves for each individual reader, as well as average ROC curves, of which there are four types.
"Reader ID" controls the individual curve for this reader.
Horizontal Average averages in specificity at every possible specificity.
Vertical Average averages in sensitivity at every possible specificity.
Diagonal Average averages in the direction of sensitivity+specificity at every sensitivity-specificity (along x=y diagonal line).
Pooled Average gathers all reader scores into one large set and calculates the ROC curve across that set.
Show Readers controls all readers individual curves.
Show Averages controls all average curves.
The chart is resizable, and its contents will scale to the new size automatically. Additionally, clicking and dragging from an upper left to lower right direction zooms the view in on that area. Clicking and dragging from a lower right direction to an upper left direction returns the view to its default zoom.
Export button can gather all curves data to one file and export to input file directory.