imrmc: Size and Analyze Multi-reader Multi-case Reader Studies, 3.1.1.1 Data Checks
3.1.1.1 Data Checks
User can use Show Statistics Chart and Show Study Design buttons to check input file. They help user to easily determine if the study has been input correctly.
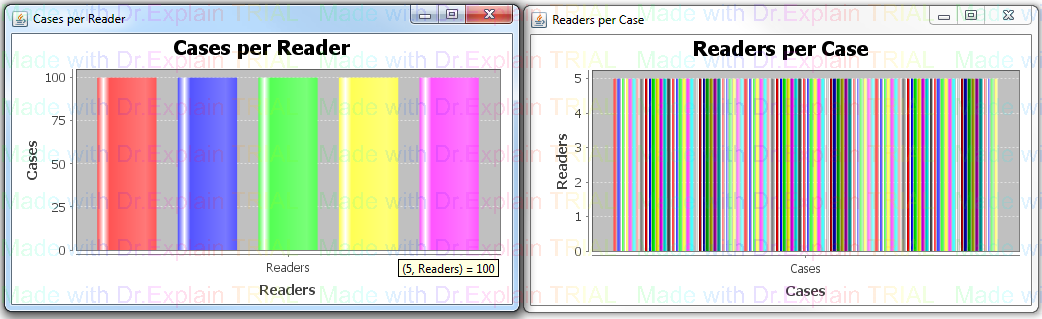
Statistics Charts
The left chart displays the number of cases that each reader scored, and the right one displays the number of readers that scored each case. The bars allow for easy visual recognition of where the study is incomplete. Hovering the mouse over a particular bar displays the relevant information for the data.
Study Design
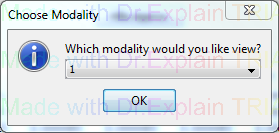
For a more in-depth view of the completeness of the study, the Show Study Design button allows the user to view the presence or absence of score data per modality. At first user should select a modality to view.
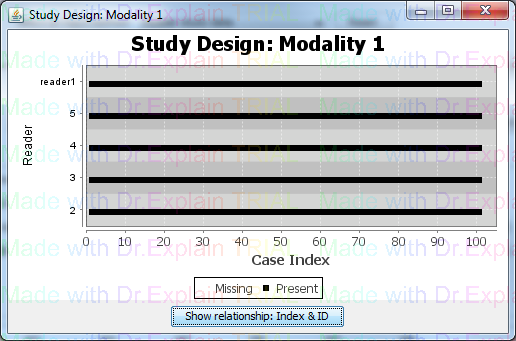
Study Design chart displays each case and each reader appears for chosen modality. A black square represents an existing score for said modality, case, and reader. A white square represents missing data at this point. Hovering the mouse over a particular square displays this information as “Case Index / Reader Index”. Note: In the chart, the Y axis label is reader ID, while X axis label is case index.
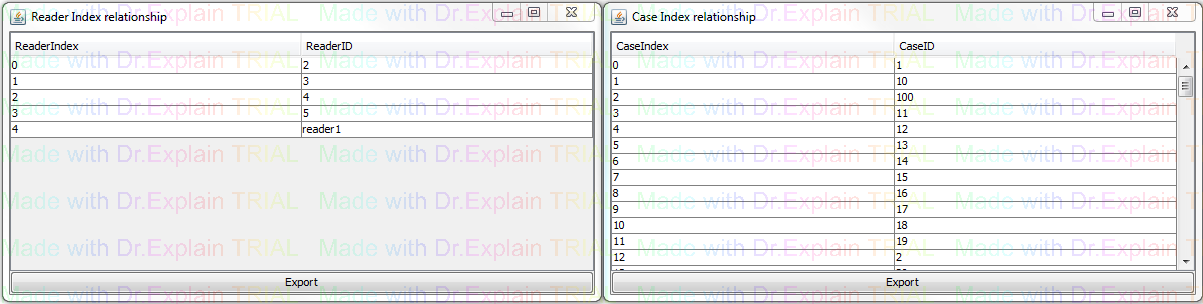
Show relationship: Index& ID button can display the relationship between Index and ID for reader and case in two windows. The "Export" button at the botton of windows could export the relationship to input file directory.